What G-force means when driving is simpler than it first appears. It is a way of describing acceleration relative to gravity, whether the car is speeding up, slowing down or changing direction. For drivers, that makes it a useful number because it helps explain what you feel through the seat, steering wheel and pedals.
This guide covers the basics in plain English, then shows how to read longitudinal and lateral G in a car or app. You will also see why G-force matters when comparing everyday road driving with closed-circuit performance driving, and what those readings can reveal about technique.
What is G-force in a car
In driving, G-force is a shorthand for acceleration measured against the acceleration caused by Earth’s gravity. The reference point is 1 g = 9.81 m/s². That does not mean your car is always pulling 1 g in normal driving. It means 1 g is the benchmark used to express how strong an acceleration event is.
If a car accelerates, brakes or corners hard enough to produce an acceleration equal to 9.81 m/s², that is 1 g. Half that level is 0.5 g. A gentler input might be 0.2 g or 0.3 g.
For drivers, the important point is that G-force is not a measure of speed on its own. A car at 120 km/h (75 mph) in a straight line can be producing very little measurable G if its speed is steady. A car at 50 km/h (31 mph) in a tight bend or under heavy braking can produce a much higher reading because acceleration is about change in speed or direction.
What 1 g means in everyday driving
A useful way to think about G is as the intensity of the change the car is making. The higher the number, the stronger the acceleration, braking or cornering load acting on the car and the people inside it.
How it feels
When the car accelerates, you feel pressed back into the seat. Under braking, you feel thrown forward against the belt. In a corner, you feel your body loaded toward the outside of the bend. Those sensations are your body reacting to the car’s acceleration.
This is why G-force is such a practical metric. It turns a subjective feeling, such as “that stop felt hard” or “that corner felt fast”, into a measurable number.
Typical context for drivers
Everyday commuting usually involves modest G levels because smooth road driving relies on gradual inputs. More assertive road driving and track driving produce higher peaks because the rate of acceleration, braking and cornering is greater.
The exact figure depends on the car, tyre grip, road or track surface, weather and driver inputs, so it is better to use G as a comparison tool than to chase a single target number.
| Driving event | What the G reading represents | What you typically feel |
|---|---|---|
| Acceleration | Forward increase in speed | Pushed back into the seat |
| Braking | Reduction in speed | Thrown forward into the belt |
| Cornering | Change in direction | Loaded sideways in the seat |
Longitudinal G vs lateral G
To read G-force properly, it helps to split it into two main directions.
Longitudinal G
Longitudinal G measures acceleration and braking in a straight line along the length of the car. Positive longitudinal G is associated with acceleration. Negative longitudinal G is associated with braking.
This is the reading to watch if you want to understand launch performance, braking consistency or how smoothly you apply the pedals. Sudden spikes can suggest abrupt inputs, while clean and repeatable traces often point to more controlled technique.
Lateral G
Lateral G measures side-to-side acceleration during cornering. The faster the change in direction and the more grip available, the higher the lateral load.
Lateral G helps explain how much work the tyres are doing in a bend. It is especially useful for seeing whether you build cornering load progressively or ask too much of the front or rear tyres too early.
Why the distinction matters
A single G number without direction tells only part of the story. A strong braking event and a fast corner might both feel intense, but they stress the car and tyres in different ways. Separating longitudinal and lateral readings makes the data far more useful for driver improvement.
- Use longitudinal G to assess launches, throttle application and braking pressure.
- Use lateral G to assess corner entry, mid-corner balance and steering smoothness.
- Compare both together to see how you combine braking and turning, particularly on circuit.
Why you feel pushed back, forward or sideways
The sensation people describe as being “thrown” in the car is the result of inertia. Your body wants to keep doing what it was doing a moment earlier, while the car changes speed or direction underneath you.
If the car accelerates, the seat pushes you forward with it, which feels like being pressed back. If the car brakes, your body continues moving forward until the seat belt restrains you. In a corner, the car changes direction but your body resists that change, which creates the sideways loading you feel.
This is also why supportive seats matter in performance driving. Better support reduces how much your body moves around under lateral G, making it easier to steer and modulate the pedals accurately.
In very high-performance machinery, these loads become much larger. Formula 1 drivers are a useful reference point here because they experience extreme G-forces under braking, acceleration and cornering. That is far beyond normal road-car use, but it shows how central G is to understanding vehicle performance.
What road cars usually show versus track driving
For most drivers, the value of G-force is not proving a headline number. It is seeing how the same car behaves in different conditions and how driver inputs affect the outcome.
Road driving
On the road, G readings are usually lower because smoothness, traffic, visibility and surface quality all limit how aggressively you can drive. Even when a car is powerful, that does not automatically mean the G trace will be dramatic during everyday use.
A brisk overtake may create a clear longitudinal acceleration peak. A firm stop may show a meaningful braking spike. But in general, road data tends to show shorter, lower-load events and a wider variation in surface grip.
Track driving
On a closed circuit, repeated heavy braking zones and sustained cornering loads create much richer G data. Here you can compare one lap with another, look for consistency and understand where the car is working hardest.
Track driving also makes it easier to see whether a higher peak is genuinely useful. A larger braking number is only helpful if it is controlled and repeatable. A bigger lateral peak matters only if it leads to a cleaner line and better exit speed.
Safety note: measure hard acceleration, braking and cornering only on a closed circuit, track day or private venue, never on public roads.
How to read G-force in an app
If your app displays G-force, the first step is to ignore the temptation to look for one magic number. Instead, read the data in context.
Look at peaks and shape
A peak tells you the maximum load reached. The shape of the graph tells you how you got there. Two drivers can both reach the same 0.8 g braking peak, but one may build pressure smoothly while the other stamps on the pedal and unsettles the car.
Compare repeated events
Repeated braking zones or similar corners are ideal for comparison. If one attempt shows 0.7 g and the next shows 0.8 g, that difference may reflect more grip, a later brake point or a more decisive pedal application. If the numbers vary wildly, consistency may be the issue.
Use G with other metrics
G-force is most useful when paired with speed, time and location. A cornering peak without knowing entry speed or line tells only part of the story. Add GPS speed and position, and the reading becomes much easier to interpret.
That is why performance apps often combine G with sprint times, braking events and route heatmaps. Together, those metrics show not just how hard the car accelerated, but where, when and how consistently it happened.
How TripRank helps measure this
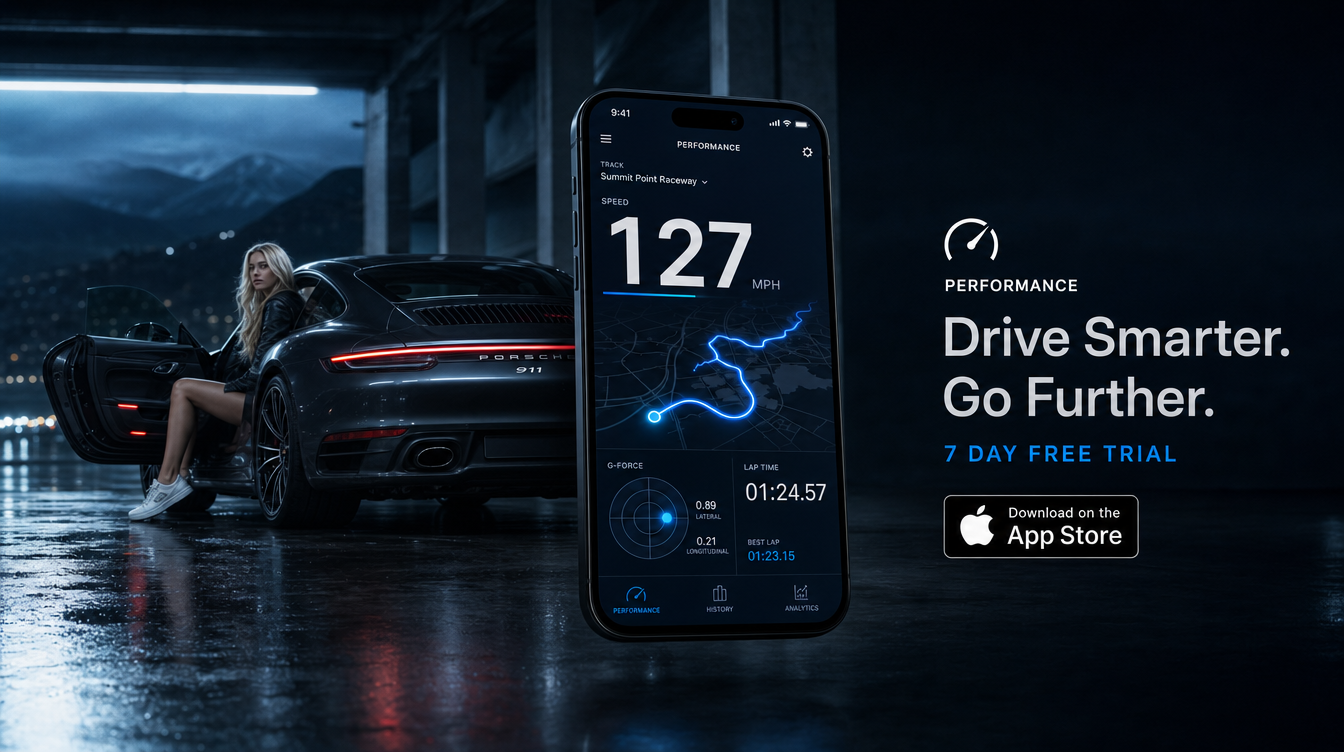
TripRank records the kinds of data that make G-force meaningful for drivers rather than abstract. Alongside GPS speed and sprint metrics such as 0-100 km/h and quarter-mile times, it tracks braking and cornering events, Drive Score, Smoothness Score and speed heatmaps. That gives you context for both longitudinal and lateral loading.
For everyday use, the value is seeing how smooth and repeatable your inputs are. For track days or private-venue testing, it helps you compare runs, identify stronger braking zones and understand where cornering loads build. The result is a clearer picture of what the car is doing and how your technique affects it.
What a good G-force reading can tell you about driving technique
A good reading is not simply the highest one. In many cases, the better sign is a repeatable number reached with control.
Smooth acceleration
If acceleration G builds cleanly instead of spiking sharply, that often suggests measured throttle application and good traction. A huge early spike may indicate wheelspin or a rough input rather than effective forward progress.
Controlled braking
Braking data can reveal whether you apply pressure progressively and consistently. A stable peak reached at a similar point each time is often more valuable than one very large but erratic stop.
Balanced cornering
Lateral G helps show whether you are loading the car progressively through the bend. Smooth build-up usually points to tidier steering inputs and better balance. Abrupt swings can suggest a rushed turn-in, correction mid-corner or inconsistent grip.
In short, G-force is one of the clearest ways to connect sensation with measurable technique.
If you want to watch racing loads translate into braking and direction changes at Yas Marina, our guide to Abu Dhabi Grand Prix 2026 tickets and fan zones explains attendance and entry.
Frequently asked questions
Is G-force the same as speed?
No. Speed is how fast the car is travelling. G-force measures acceleration, which means how quickly speed or direction changes. A car can be travelling quickly with low G if its speed is steady.
What does 1 g mean in a car?
It means the car is producing an acceleration equal to Earth’s gravitational acceleration, which is about 9.81 m/s². In driving, that could happen under strong braking, hard acceleration or high-grip cornering, depending on the car and conditions.
What is the difference between longitudinal and lateral G?
Longitudinal G is forward-and-back acceleration, so it covers braking and acceleration. Lateral G is side-to-side acceleration, so it covers cornering.
Why does G-force matter for drivers?
It helps turn feel into data. Instead of guessing whether a braking zone was stronger or a corner was taken more cleanly, you can compare measurable loads and relate them to technique, grip and consistency.
Can you measure G-force accurately on public roads?
An app can measure everyday acceleration changes on public roads, but performance testing should not be done there. Hard acceleration, threshold braking and limit cornering should be measured only on closed circuits or private venues.
A clearer way to understand what the car is doing
G-force matters because it explains the loads that make a car feel fast, stable, sharp or demanding. Once you separate acceleration, braking and cornering into longitudinal and lateral G, the numbers become far easier to read.
For enthusiastic drivers, that makes G more than a technical term. It becomes a practical tool for understanding vehicle behaviour, comparing runs and improving smoothness and consistency in the right environment.