
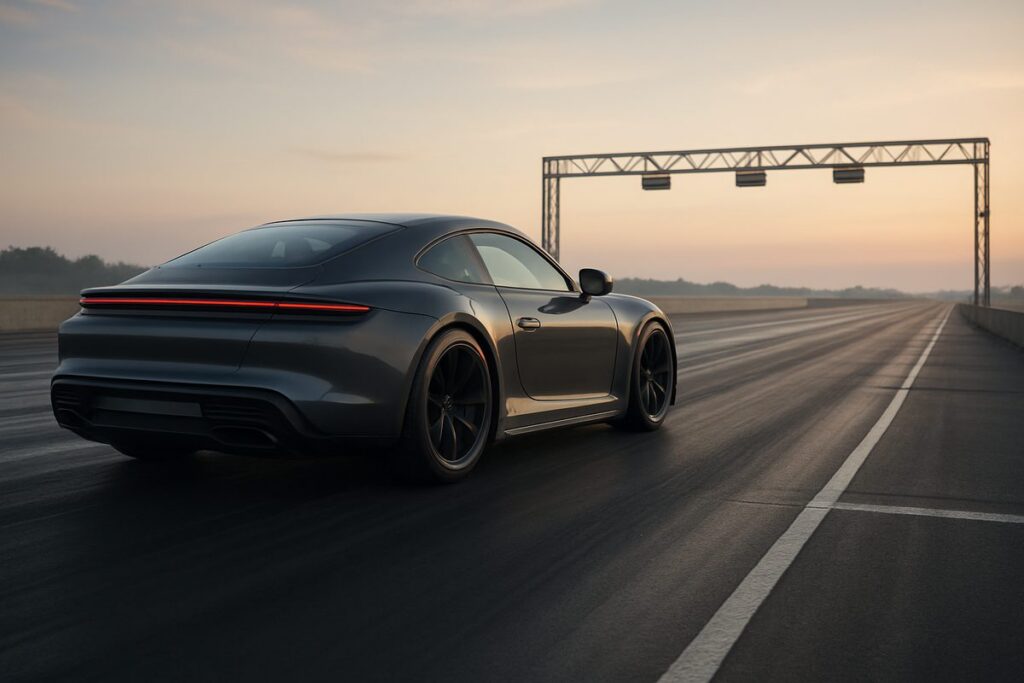
Rollout in acceleration times explained starts with one simple idea: the clock does not always begin at the exact same moment a car starts to move. That small timing difference can make a 0–60 mph, 0–100 km/h or quarter-mile result look quicker, even when the car itself has not changed.
This guide explains what rollout means, how drag-strip timing systems create it, why magazines and apps can publish different figures, and how to compare results fairly. If you measure your own runs, it also shows why consistency matters more than chasing a single headline number.
What rollout means in plain language
Rollout is the short distance a car travels before the timing clock officially starts. In a drag-racing context, the car is staged at the line, then moves forward slightly before it clears the staging beam and triggers elapsed-time timing. That means the vehicle has already begun accelerating before the recorded run starts.
The effect is simple: timings recorded with rollout usually look faster than timings recorded from true first movement or from a strict standing start. The car gets a small head start in distance and speed before the clock begins.
This matters most in short acceleration tests such as 0–60 mph and 0–100 km/h, where a few tenths of a second can change the story. It also affects quarter-mile comparisons when one source reports strip-style elapsed time and another reports timing from initial motion.
How drag-strip timing creates rollout
Staging beams and the start line
NHRA drag racing describes the sport as an acceleration contest from a standing start. At the starting line, electronic beams determine when a car is correctly positioned and when timing begins. The pre-stage and stage lights tell the driver how close the front tyres are to the line.
A key detail is that the starting-line staging beams are 7 inches apart. Once the front tyres are staged, the car can move forward a short distance before it fully exits the stage beam. That travel is the basis of rollout.
Elapsed time versus reaction time
Reaction time and elapsed time are different measurements. Reaction time is how long it takes the driver to leave after the start signal. Elapsed time is how long the run itself takes once the car has triggered the timing system. NHRA also notes that reaction time is affected by an individual track’s rollout length, which shows that rollout is a real timing variable, not a theoretical one.
On a drag strip, official timing is broken into segments rather than one single end result. NHRA timing commonly includes 60-foot, 330-foot, 660-foot, 1,000-foot and 1/4-mile intervals. The standard full race distance is 1/4 mile, or 1,320 feet, while Top Fuel and Funny Car run 1,000 feet.
| Common drag timing point | Distance | Metric equivalent |
|---|---|---|
| 60-foot | 60 ft | 18.29 m |
| 330-foot | 330 ft | 100.58 m |
| 660-foot | 660 ft | 201.17 m |
| 1,000-foot | 1,000 ft | 304.8 m |
| 1/4-mile | 1,320 ft | 402.34 m |
That segmented approach helps explain why the exact start method matters. If timing begins after the car has already moved slightly, every downstream interval can appear a little quicker than a true movement-based measurement.
Why rollout makes acceleration numbers look quicker
Imagine two identical cars producing the same acceleration. One is timed from the instant it first moves. The other is timed only after it has rolled forward enough to clear the stage beam. The second method starts the clock later, so the final number is lower even though the physical performance is the same.
That is why rollout often makes 0–60 mph and 0–100 km/h figures look better on paper. By the time the timer begins, the car may already be moving at a low speed rather than sitting at exactly 0 km/h.
The practical impact depends on the setup, the tyre diameter, how the vehicle is positioned in the beams and how the timing system defines the start. Because the staged position is not identical in every case, rollout is not one universal fixed number.
Deep staging and positioning matter
Driver positioning can alter rollout too. A car staged shallowly may have a longer distance to travel before it clears the beam. A car staged more deeply may reduce that distance. NHRA explicitly recognises rollout length as a factor in reaction-time behaviour, which underlines that staging position changes measured results.
For road-car testing, this means two runs can differ slightly before traction, power or gearing are even considered. The timer’s definition of the starting point is part of the result.
Rollout versus true start from rest
When readers compare acceleration claims, the most important question is not just how fast, but how measured. There are two broad approaches:
- Timing with rollout: the clock starts after a short initial movement, similar in principle to drag-strip beam timing.
- Timing from true movement: the clock starts at the instant the vehicle begins moving from rest.
If a publication quotes a very quick 0–60 mph time, it may be using a rollout-adjusted figure. If an app uses GPS data and starts timing from actual motion, the result may be a little slower but more representative of a strict standing-start measurement.
Neither method is automatically wrong. The problem comes when figures are compared without stating which method was used.
| Timing method | Clock starts when | Typical effect on result | Best use |
|---|---|---|---|
| Rollout-based | After the car moves through the start reference | Quicker published acceleration time | Comparison with drag-strip style or rollout-adjusted tests |
| True movement-based | At first measurable vehicle motion | Slightly slower but stricter standing-start figure | Repeatable GPS testing and transparent app-based measurement |
Why magazines, apps and tracks can disagree
Different timing references
A drag strip uses fixed beams and known distances. A GPS-based app uses position and speed data to determine when a run starts and ends. A magazine may use specialist equipment, VBOX-style systems or a rollout convention for comparability with previous tests.
As a result, one car might record different headline figures across different sources even if conditions are broadly similar. The differences do not always mean one source is inaccurate. Often they reflect different definitions of the start.
Short tests magnify small timing changes
Rollout matters more in a short sprint than in a long one. In a 0–100 km/h run, removing even a small portion of the earliest movement phase can trim the final result noticeably. In a quarter-mile run, the effect is still present, but the percentage change is smaller because the total elapsed time is longer.
Conditions still matter too
Even with the same timing method, comparisons can still be distorted by surface grip, tyre temperature, launch control strategy, wind, gradient and ambient temperature. That is why the best tests prioritise repeatability and clear methodology over a single low number.
Safety note: measure acceleration and launch performance only on a closed circuit, drag strip or private venue with appropriate supervision.
How to compare acceleration times fairly
If you want meaningful like-for-like comparisons, use a simple checklist:
- Check the start method. Was the run timed with rollout or from first movement?
- Check the units. 0–60 mph is not the same test as 0–100 km/h.
- Check the venue. Drag-strip timing and GPS timing are not identical systems.
- Check repeatability. Multiple runs in both directions are more useful than one best pass.
- Check the stated distance. Quarter-mile is 1,320 feet or 402.34 m, while some professional classes run 1,000 feet.
- Check transparency. The source should explain its method, not just quote the quickest number.
For enthusiasts, the goal should be consistency. If you always use the same car, surface, tyre pressures and timing method, you can track improvements reliably. If you switch between rollout-adjusted figures and true-start figures, trend analysis becomes much less useful.
How TripRank helps measure this
TripRank helps drivers record acceleration metrics such as 0–100 km/h, 0–200 km/h and quarter-mile times using the same app environment each time. That consistency matters when rollout and timing definitions can change the final number.
Beyond sprint figures, the app also logs GPS speed, G-force, braking and cornering events, Drive Score, Smoothness Score and speed heatmaps, with CarPlay, Apple Watch heart-rate sync and global leaderboards. For enthusiasts comparing runs over time, transparent measurement and repeatable data are usually more valuable than a single optimistic headline figure.
Peugeot E-T16’s claimed acceleration also shows why the stated speed interval matters before comparing headline times.
Frequently asked questions
Is rollout the same as reaction time?
No. Reaction time measures how quickly the driver responds to the start signal. Rollout is the distance the car travels before the elapsed-time clock begins. They are related in drag racing because staging position and rollout length can influence the recorded reaction time, but they are not the same metric.
Why do some 0–60 mph times look faster than my app result?
A published 0–60 mph time may use rollout, whereas your app may start timing from actual vehicle movement. That makes the published figure look quicker even if the car’s real-world acceleration has not changed.
Does rollout affect quarter-mile times too?
Yes. If elapsed time begins after the car has already moved a short distance, the quarter-mile number can also look quicker. The effect is usually more noticeable in short sprints such as 0–60 mph or 0–100 km/h because the total timed event is shorter.
Can rollout vary between tracks or runs?
Yes. NHRA notes that reaction time is affected by the individual track’s rollout length, and staging position also changes how much distance the car covers before the timer starts. That means rollout is not always identical from one setup to another.
What is the fairest way to compare two cars?
The fairest comparison uses the same timing method, the same distance, similar conditions and several repeat runs. A slower-looking true-start figure can be more useful than a quicker rollout figure if the methodology is clearly stated and consistently applied.
A clearer way to read acceleration claims
Rollout is a small detail with a large effect on perception. It changes when the clock starts, which changes the number people remember. Once you understand that, many apparently conflicting 0–60 mph, 0–100 km/h and quarter-mile claims become easier to interpret.
For anyone measuring performance, the best approach is straightforward: use a consistent method, record the context and compare like with like. That makes your data more honest, more repeatable and far more useful than any standalone headline figure.